
How Exposed Is Your Account to a Few Big Spenders?
Measure how much of your commission rides on a handful of referred members, using top-N share and HHI, and learn what to do when the numbers say you're exposed.
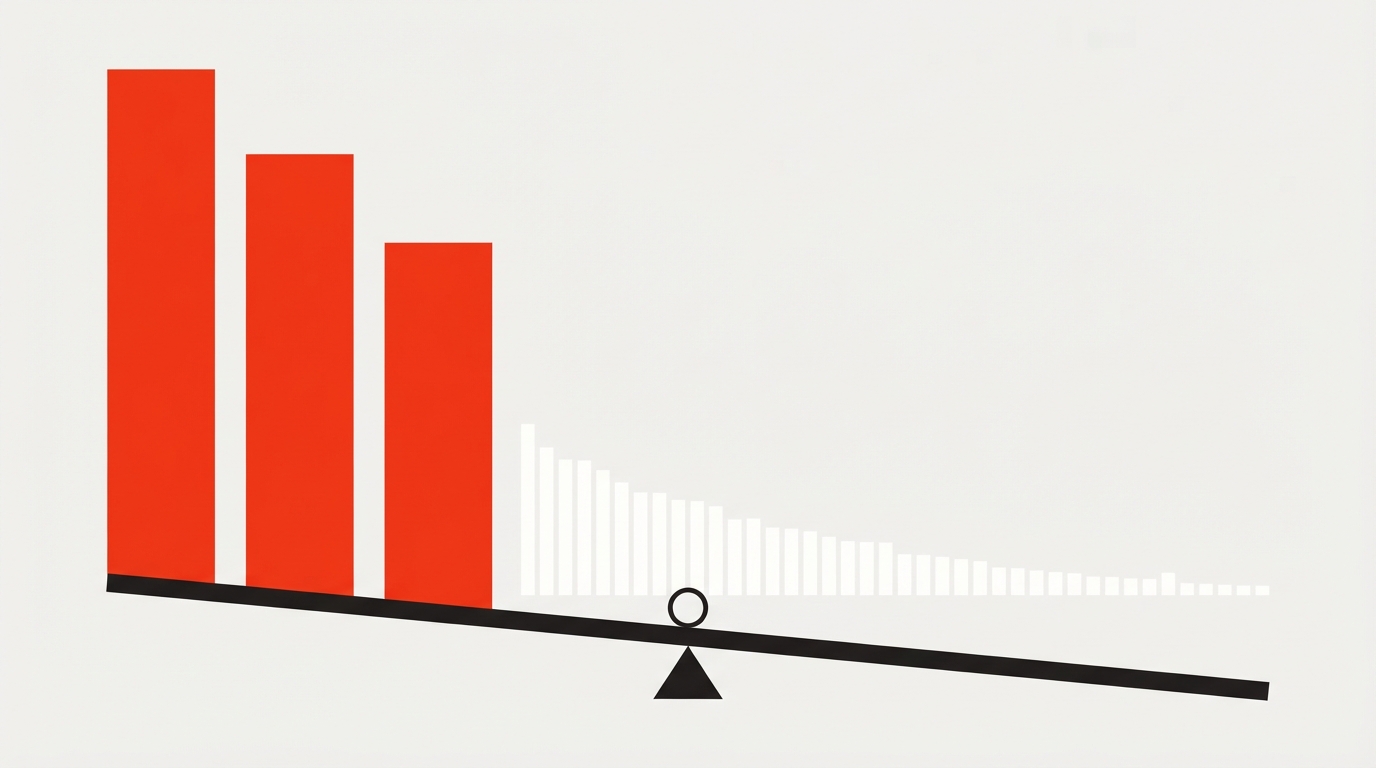
Two affiliate accounts can both show $2,000 in commission last month and be completely different businesses. In one, a few hundred referred members each contributed a few dollars. In the other, three members produced most of the total and everyone else was a rounding error. The first account will look much the same next month. The second might be cut in half, or doubled, by decisions made by three people you will never meet.
That difference is revenue concentration. It is easy to measure from data you already have, and it does not require you to know or profile anyone. This article covers how to calculate it, which thresholds to watch, and what to do if your account turns out to be more exposed than you thought.
Why the payout structure makes concentration visible
Most third-party reviews describe the Chaturbate affiliate program as a flat 20% revenue share on referred members' token purchases, with no tiers or volume bumps. Attribution is described as lifetime: you earn on a referred member's purchases for as long as their account exists, so one active member can generate commission for months or years.
I could not find a first-party source for the program terms, so check the rate and attribution rules against your own affiliate dashboard. But if those descriptions hold, the consequence is simple. A heavy spender passes through to your statement at a fixed percentage of their spend, and nothing in the structure smooths it out. That is an inference, not a published finding, but it matches how the numbers tend to look in practice: a long tail of small payers and a short head of large ones.
Spend skew like this is common in freemium models. In free-to-play gaming, roughly 1–2% of players are reported to account for more than half of revenue, though other sources give different ranges. That is an analogy only. I found no reliable published breakdown for cam platforms, so your own data is the only evidence that matters.
Three numbers worth calculating
All three work on shares and counts of commission. You never need a member's identity, only a ranked list of amounts for a period.
1. Top-N share
Take the commission from your largest referred payer and divide it by your total commission for the same period. That is top-customer share. Top-3, top-5 and top-10 shares work the same way. Use the same total as the denominator every time.
2. HHI (Herfindahl-Hirschman Index)
Convert each payer's share to percentage points, square it, and add the squares. The result runs from 0 to 10,000. If you only have the top 20 payers handy, you get a slight underestimate, because the tail adds a little. For a long tail of tiny payers, the difference is small.
3. Effective number of payers
Divide 10,000 by your HHI. The result is the number of equal-sized customers your book really behaves like. This is the easiest of the three to reason about.
Here is a hypothetical example. Account A has ten payers at 10% each. Its HHI is 10 × 100 = 1,000, so it behaves like ten equal payers. Account B has one payer at 50% and ten at 5% each. Its HHI is 2,500 + (10 × 25) = 2,750, so it behaves like about 3.6 payers, even though it has eleven.
You need more than top-N share because it can't separate these cases. One source gives the example of a company with one 18% customer and 82% spread across 300 small accounts, which is far safer than ten customers at 10% each. Top-customer share alone would call the first one riskier. HHI gets it right.
Thresholds to monitor
No published threshold exists for cam affiliate revenue share. Everything below is borrowed from B2B and SaaS guidance, so treat it as a rule of thumb and not a verdict.
- Single payer: one glossary flags a single customer above 10% of revenue as a concern.
- Top 5: one source rates above 40% high risk, 20–40% moderate, and below 20% low.
- Top 3: a simpler small-business rule says above 50% likely means overexposed.
- HHI: the same small-business source uses below 1,000 as low, 1,000–2,000 as moderate, above 2,000 as high. Other sources draw the lines higher, at 1,500 and 2,500.
Bands disagree, so pick one set and stick with it. I would use the stricter HHI bands. Those benchmarks were written for businesses with contracts and account managers. Your referred members can stop spending without notice and without a conversation, so a stricter limit is reasonable.
By those bands, Account B above is in the high-risk zone. Account A sits at the border between low and moderate.
The number that matters most is the trend. Calculate these figures monthly and watch the direction. A rising top-5 share can mean your base is stagnating while a few members spend more, which is a different problem from losing small payers.
Why a concentrated account behaves differently
Month-to-month swings are larger. If one payer is 30% of your commission, a quiet month from them moves your total by nearly a third before anything else changes. Your average looks fine; your individual months do not.
Forecasts are weaker. A trend line fitted to a concentrated account mostly tracks whether a few people were active. Smooth-looking history can hide a thin base.
Reversals hit harder. In general affiliate practice, a chargeback reverses the commission, and if it was already paid it is deducted from future earnings. The same source says chargeback windows can run up to 120 days, sometimes longer. A forum thread from around 2019 describes Chaturbate affiliates seeing negative earnings after a chargeback until later earnings offset it. That is anecdotal and old, so confirm current treatment in your affiliate terms. My own inference is that a larger purchase is a larger exposed transaction, so a concentrated account carries more reversal risk per event.
Payout timing amplifies it. One 2026 guide says affiliates are paid twice a month with a holding period, and that balances under the minimum roll over. Other reviews disagree on frequency and minimums, so verify yours. The point is that a single large member can decide whether a given pay period clears the threshold at all.
What to do about it
- Forecast on the base, not the peak. Calculate your commission excluding your top three payers. Treat that as your floor-style planning number and everything above it as variable. This is not a guarantee of anything, just a more honest baseline.
- Match fixed costs to the stable part. If ad spend, tools or personal commitments depend on a month that included a large spender, you are budgeting against revenue that may not repeat.
- Widen the base. The only real fix for concentration is more payers, not more attention on the biggest ones. Look at which traffic sources, countries and times of day bring in referred members who go on to spend steadily, then put effort there. Do this at the level of segments and cohorts, not individuals.
- Hold a buffer for reversals. If a large share of a recent payout came from one source, consider keeping some of it aside until the chargeback window has plausibly passed.
- Watch for slow drift. Concentration often rises quietly as small members churn. A falling count of payers with a steady total is worth knowing about early.
If you are thinking about selling your account at some point, expect a buyer to look at concentration too. I have no sourced evidence on how cam-account buyers value it, so treat that as a reasonable guess and not a fact. And for anything involving taxes or finances, a professional is the right person to ask.
The short version
Rank your payers by commission, calculate top-5 share and HHI, convert HHI to an effective number of payers, and track all three monthly. Use one set of thresholds consistently, and plan around the base that remains when the biggest spenders are removed.
Chaturistics already tracks big spenders in aggregate; the Whale Watcher is one example. If you would like to see your own concentration trend alongside daily revenue and cohorts, you can create a free account and connect your stats feed.
Published November 19, 2026